Guest Portal and Campaign Management
Guest Portal
Captive Portals or Guest Portal is a multi-channel platform that enables you to connect and engage with visitors on your premises.
Guest portal screen page allows to create and design a customizable portal from scratch.
A sample of templates will be given as an option to choose to create a portal, layout will be available as a part of the template.
Following are the steps to configure the Guest Portal.
Captive Guest Portal Configuration
The captive portal is designed with following terms that are described below:
- Social Authentication
Needs authentication using social platforms as Facebook, Twitter, Linked, Google and Instagram. - Email Authentication
It will ask the user for their Name and Email address to be able to Authenticate. - SMS Authentication
It asks the user for their contact number and authenticate over a SMS. - Multi device Token
A token is generated by the admin. User can use this token for authentication. One or multiple devices can be configured to use a single token. - Username/Password
A guest user can be created by generating a unique username and password which is used for authentication. One or multiple devices can be configured using individual username/password combination. - Third party
Kloudspot can integrate with various third-party applications such as, - ERP
- PMS
- POS
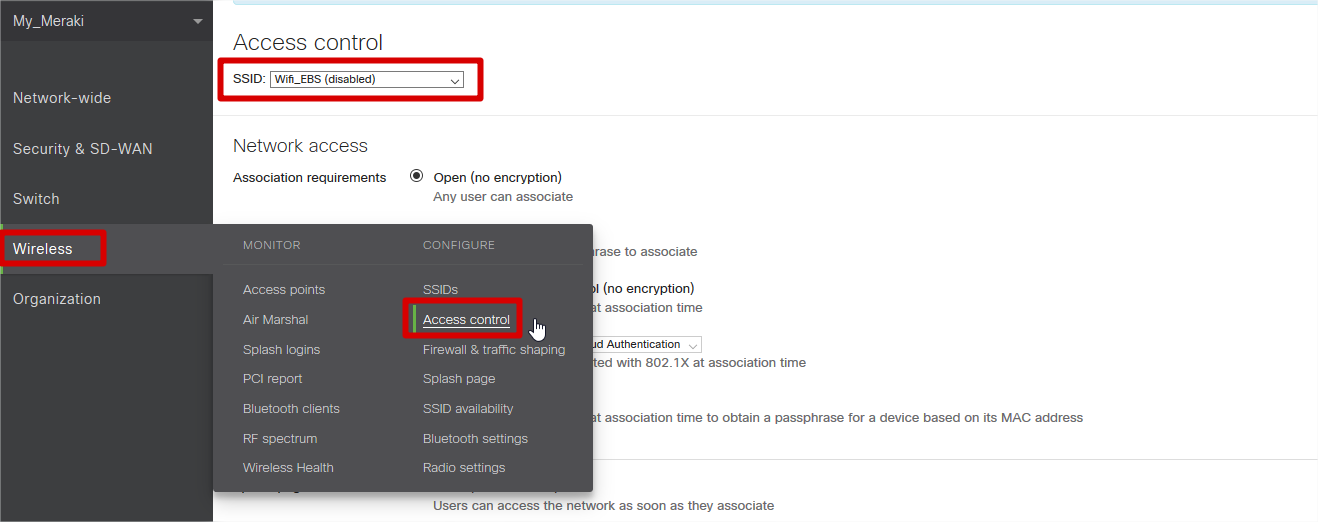
Step 1: Enter ‘Wireless’ > ‘Access Control’
Step 2: Choose the SSID to which the Captive portal will be configured.
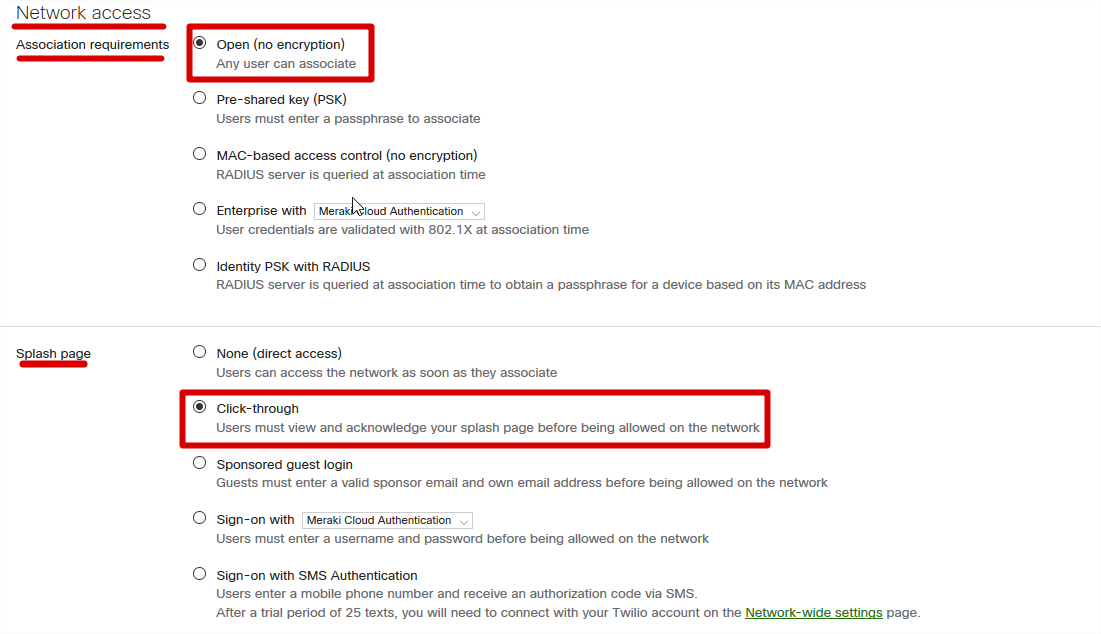
Fig 2: Setup Network Access Requirements
Step 3: Network Access, Association requirement, Select ‘Open (no encryption)’.
Step 4: In Network Access, Splash page, Select ‘Click-through’.
Step 5: In Network Access, Captive portal strength,
Select ‘Block all access until sign-on is complete’In Network Access, Walled garden ranges, Enter the following domains:
*.kloudspot.com * .facebook.com * .facebook.net * .akamaihd.net * .fbcdn.net * .atdmt.com * .fbsbx.com *. twitter.com * .twimg.com
Note: You have to separate them only with a space, as shown in the image
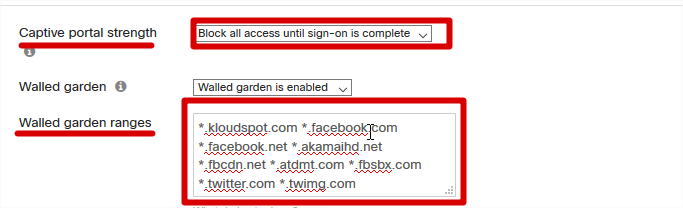
Fig 3: Captive Portal Settings
Step 6: In the end Save changes.
Step 7: Enter Wireless, click on ‘Splash page’.
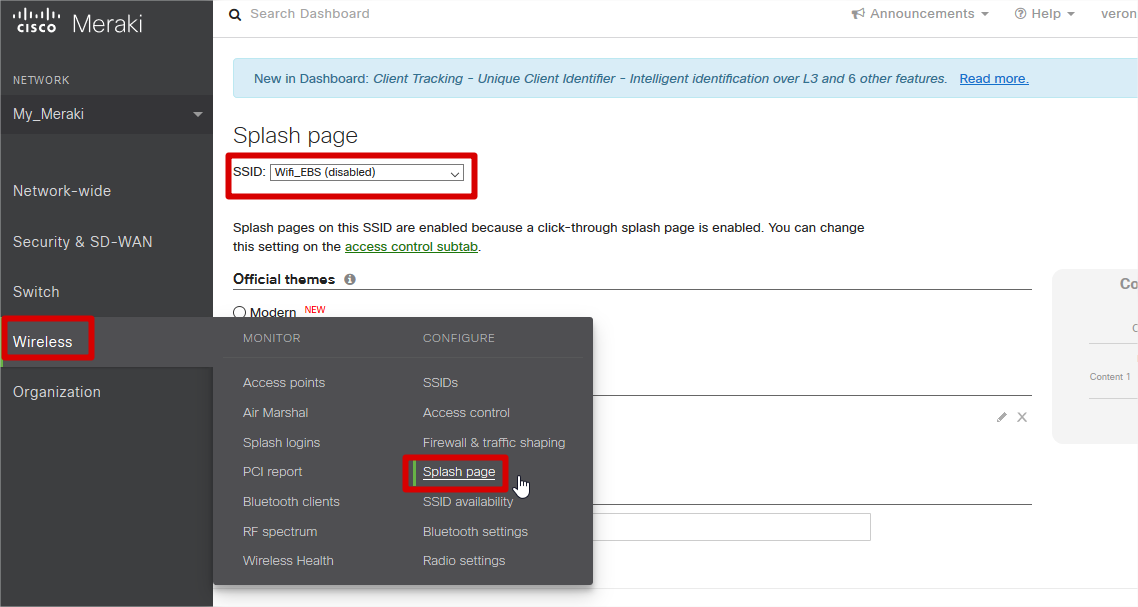
Step 8:Choose the SSID to which the captive portal will be configured.
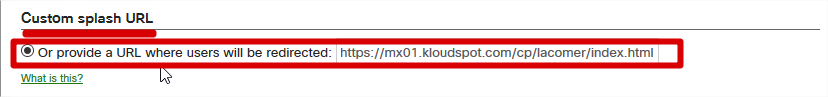
Step 9: On ‘Splash page’, Custom splash URL, enter the url below;
https://mx01.kloudspot.com/cp/lacomer/index.htm
Step 10: Save changes and Exit.
For more details on how to create template and workflow driven portal, please refer to Kloudspot documentation
- https://documentation.kloudspot.com/help/campaign-management-active-portal-setup
- https://kloudspot.com/wp-content/uploads/2020/12/KloudPortal.pdf
Campaign Management
Kloudspot has a powerful workflow and policy driven campaign management solution centered mostly around Wi-Fi which offers both online and offline campaigns. These online campaigns can be created and managed using Captive Guest Portals. Creation of Captive guest portals is extremely easy using one of many templates supported by KloudCampaign Editor. KloudCampaign Editor can help guide the user to create a captive portal for the hardware they have deployed on the network.
For more details on how to create Campaigns, resources and configure dynamic policies and workflows, please refer to Kloudspot documentation
https://documentation.kloudspot.com/help/campaign-management-active-portal-setup
Meraki Wi-Fi & BLE Event Receivers
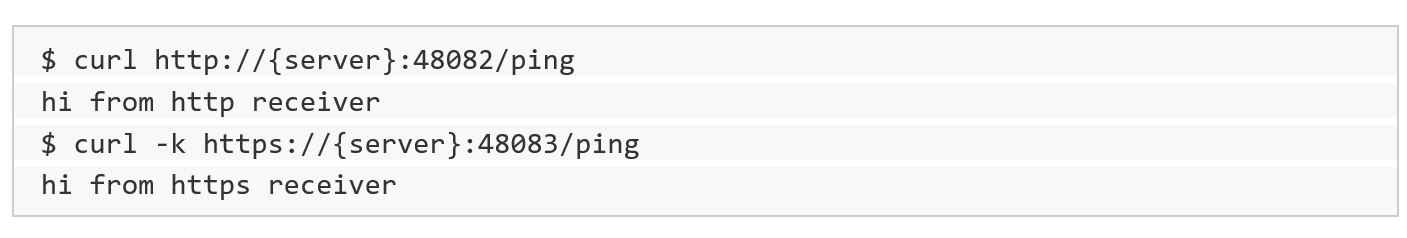
Validate the Receiver URLs
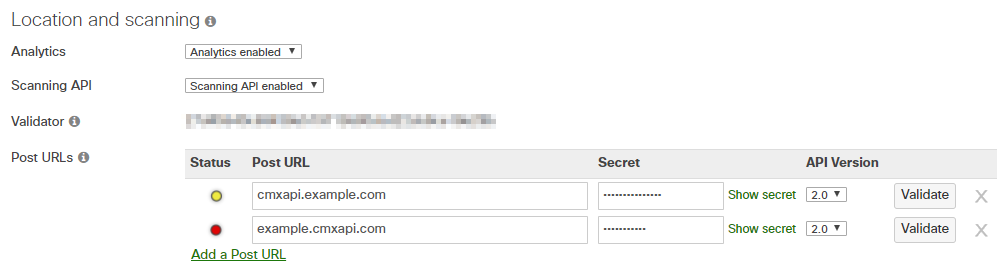
Meraki Location Scanning API
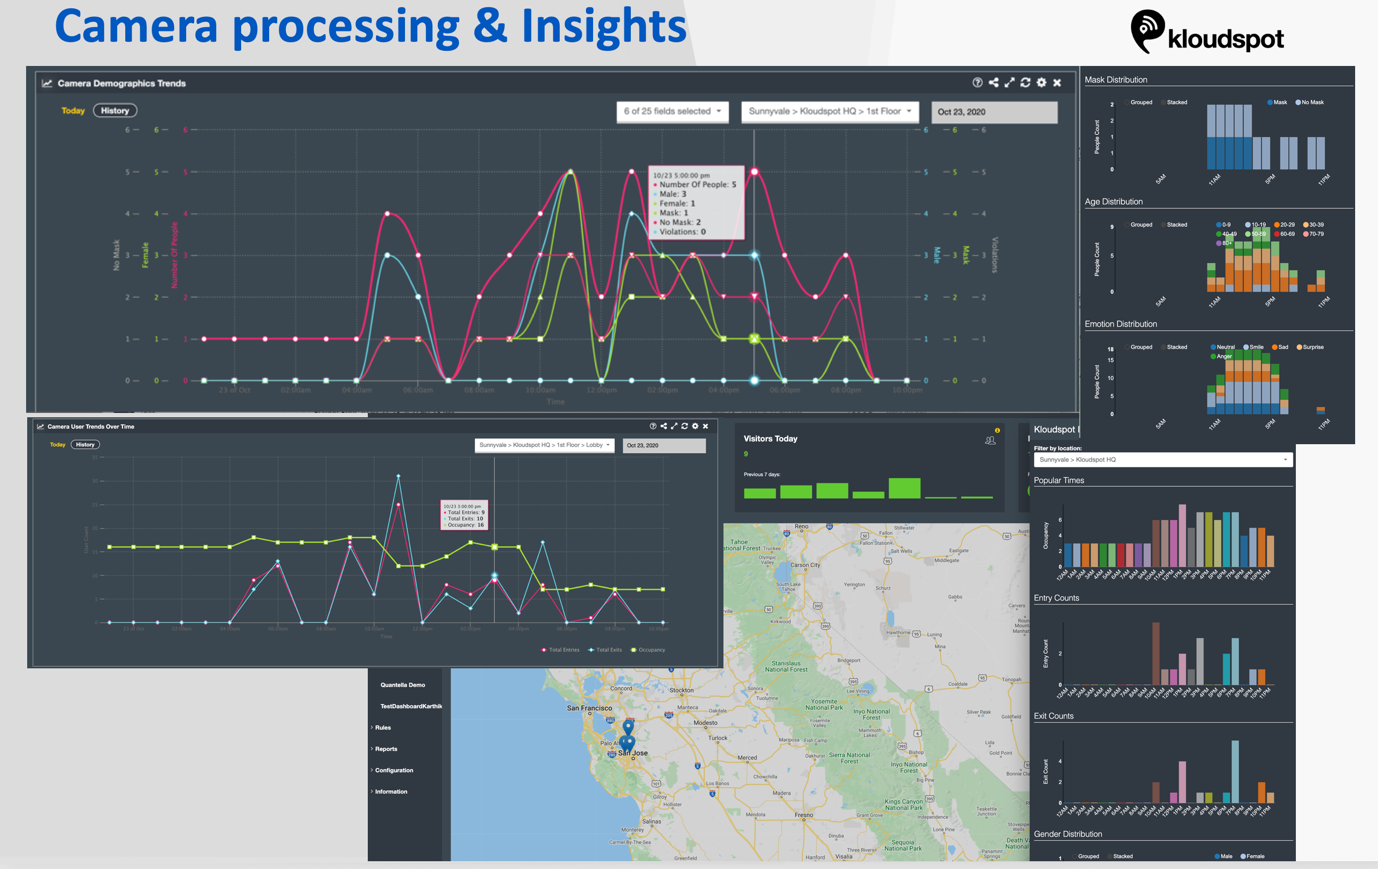
Integrating Meraki camera
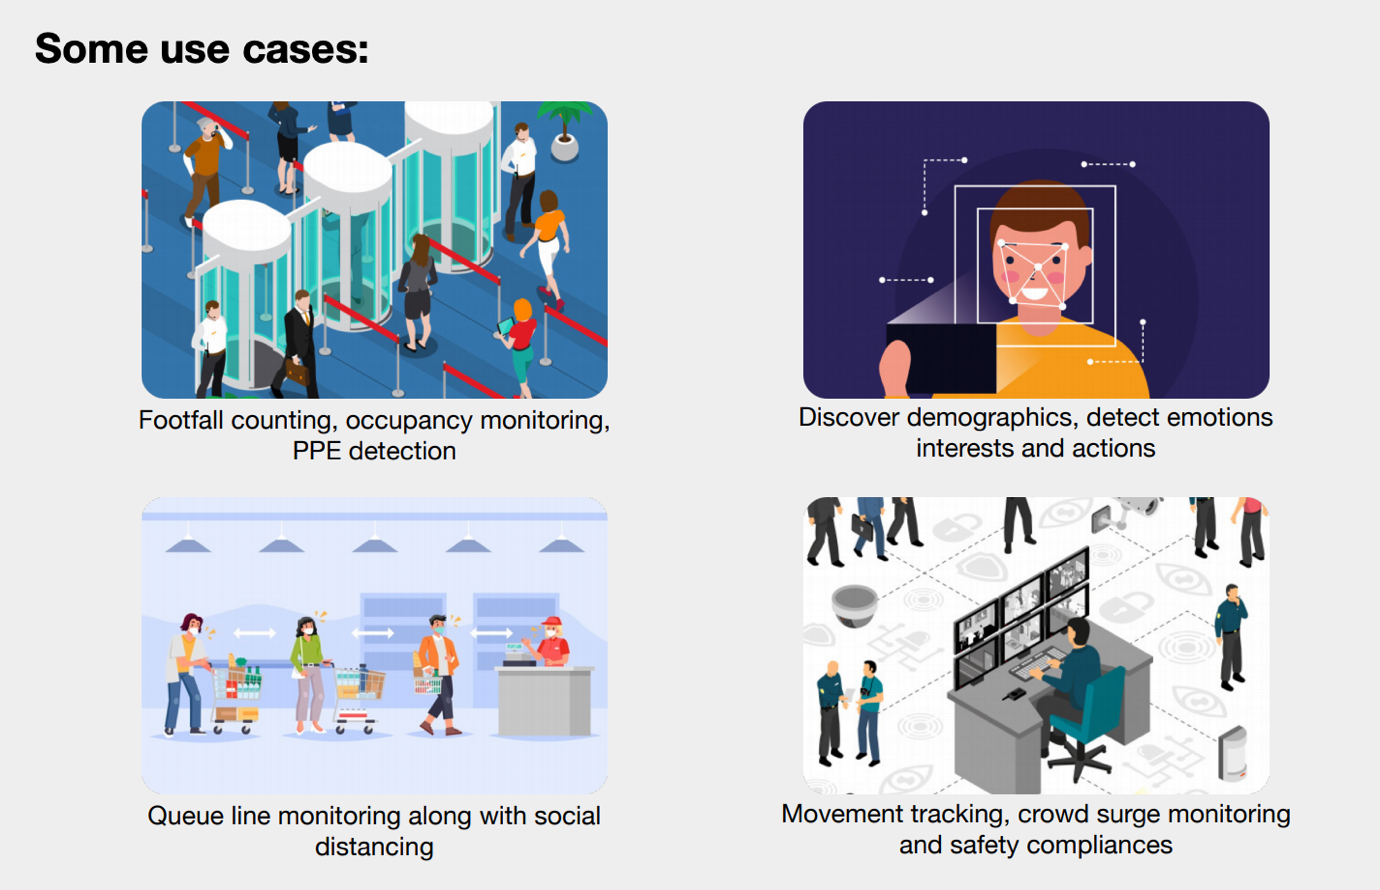
Insights inferred from RTSP stream
RTSP integration
MV Sense integration
Step 1: Port number 6666(TCP) should be exposed to send Meraki camera payloads to the Insights.
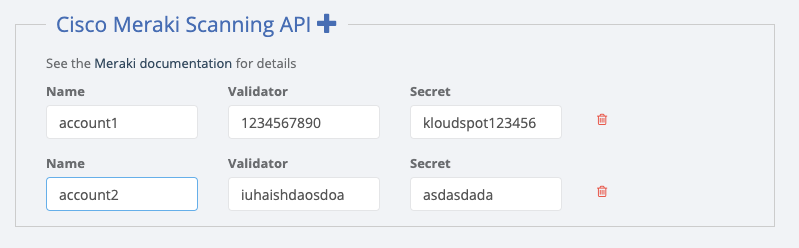
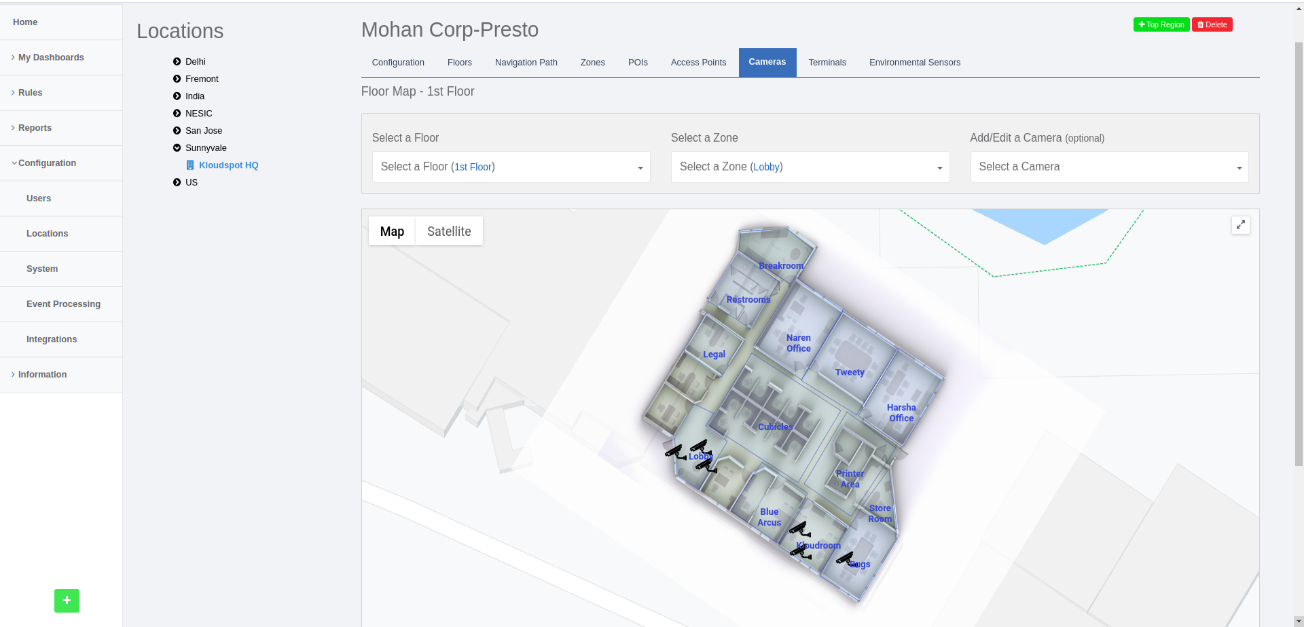
Step 2: On UI, go to configurations and click on locations. Add the location (Region/site) where the cameras need to be deployed. Then navigate to the ‘Cameras’ section.
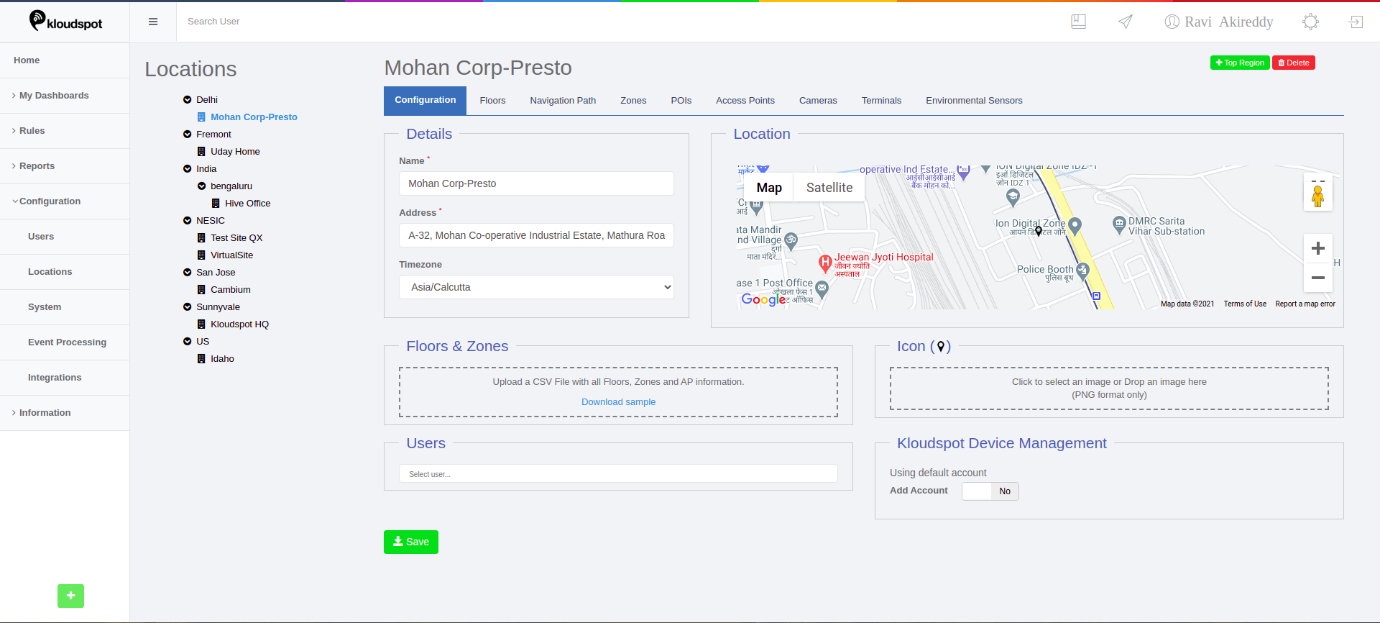
Step 3: Click on the ‘Cameras’, select the floor and the zone to which you want to add the camera and click on ‘add/edit a camera’ and then click on “Add a Camera” as shown in figure below.
Step 4: ‘Add/Update Cameras’ dialogue box needs to be filled with following information.
- Choose the vendor as ‘Third Party Camera’. Enter the Unique Id of the Meraki Camera in ‘camera name’ section.
- Upload the image that is seen by the camera in “PNG” format in the “camera Image” section (Image size less than 2MB).
- Choose the grid resolution for the camera through the slider (default value is 50px) in the advance settings.
- Click on ‘Save’ to add the camera.
NOTE: Grid resolution is the resolution of each grid in pixels the image would be divided for heatmap calculations.
Adding widgets which use Meraki payloads to the dashboard.
Step 1: On the homepage, navigate to ‘My Dashboards’ and select an existing dashboard or create a new dashboard.
Step 2: On the selected dashboard scroll down to the bottom and click on the ‘+’ symbol to add widgets to the dashboard.
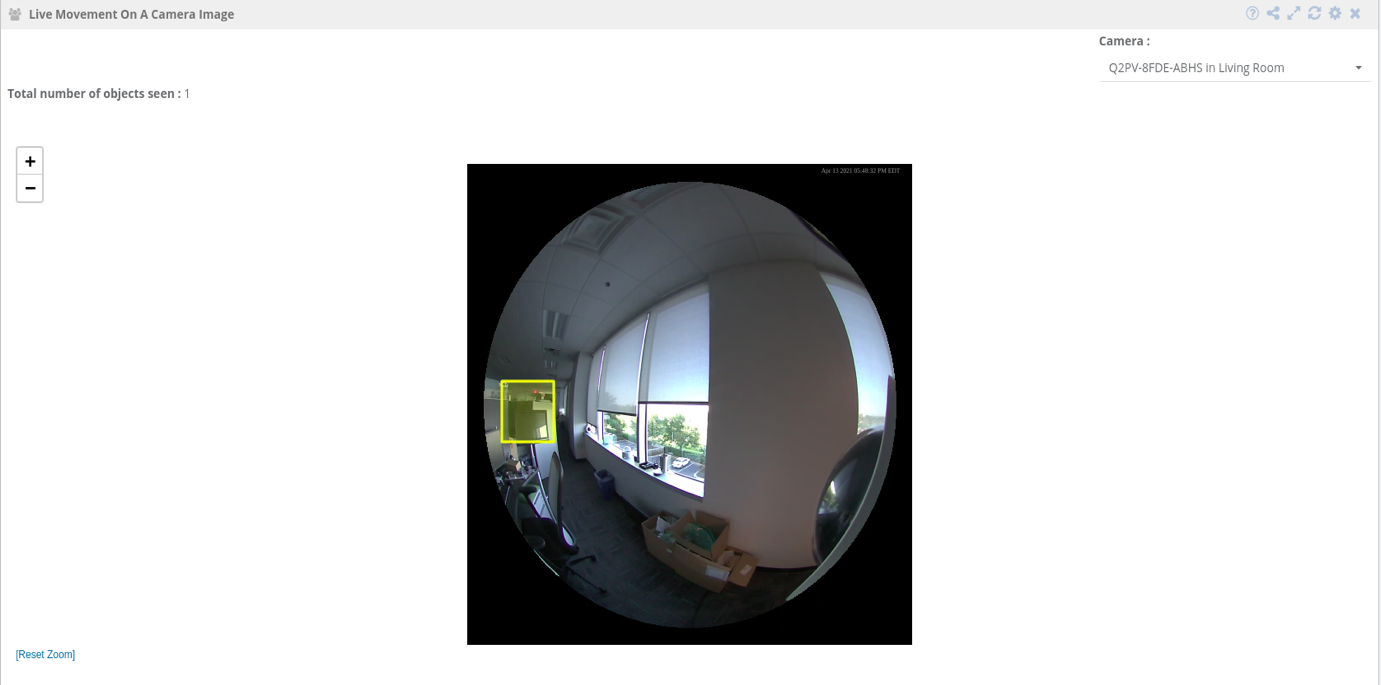
Live Movement on a Camera Widget
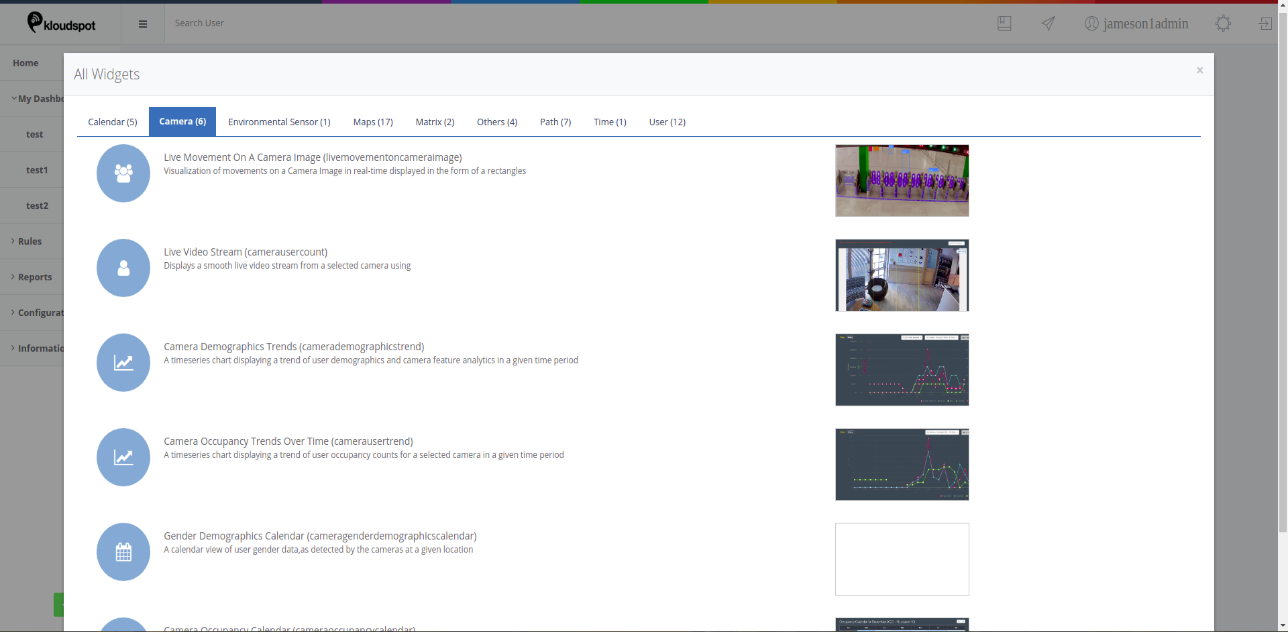
Step 1: To add the ‘Live Movement on a Camera Image’ widget navigate to the ‘Camera’ section and select ‘Live Movement on a Camera Image’ widget.
Step 2: Select the location in which the camera is configured through the ‘Settings’ option by clicking on the gear symbol.
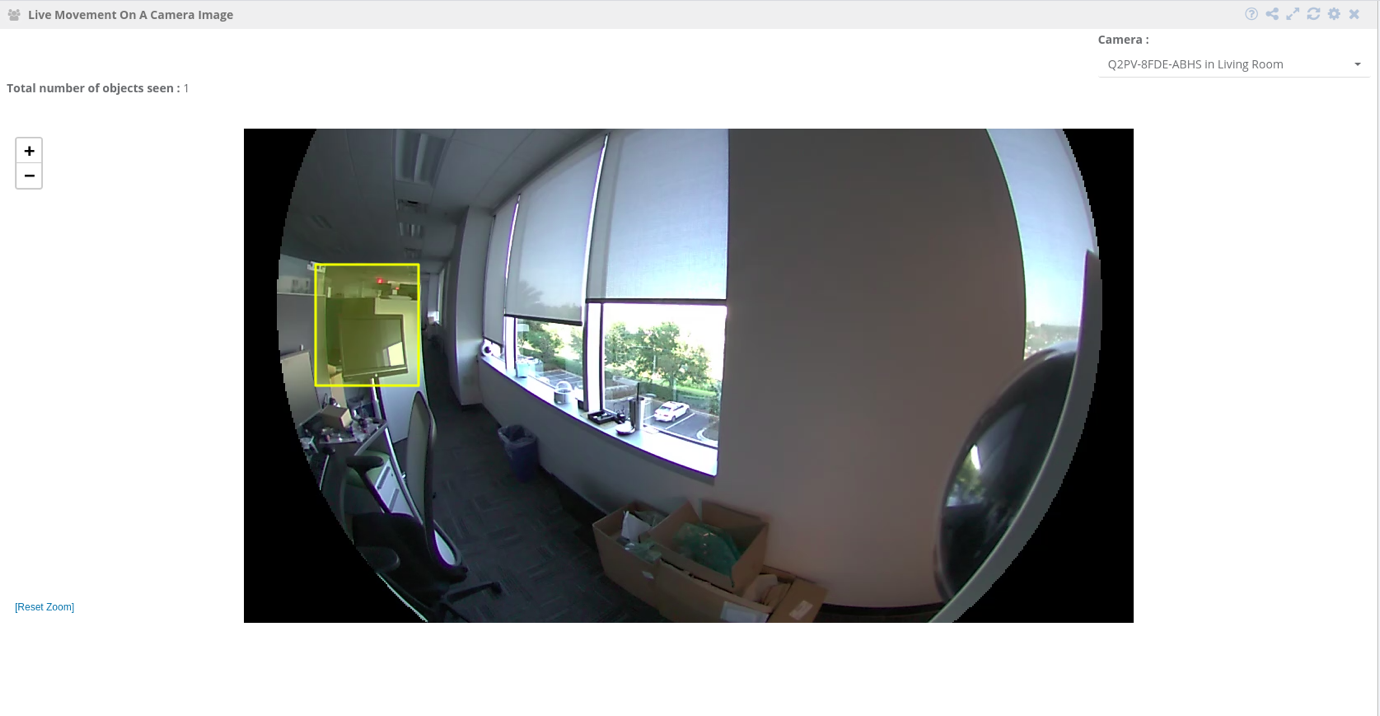
Step 3: Select the camera for which you want to see the live movements.
Step 4: Once the camera is selected the live movements of the objects are seen on the camera image in the form of rectangles. User can hover over the rectangle to get more details of the object.
NOTE: User can Zoom in and out using the ‘+’ and ‘-‘symbols respectively.
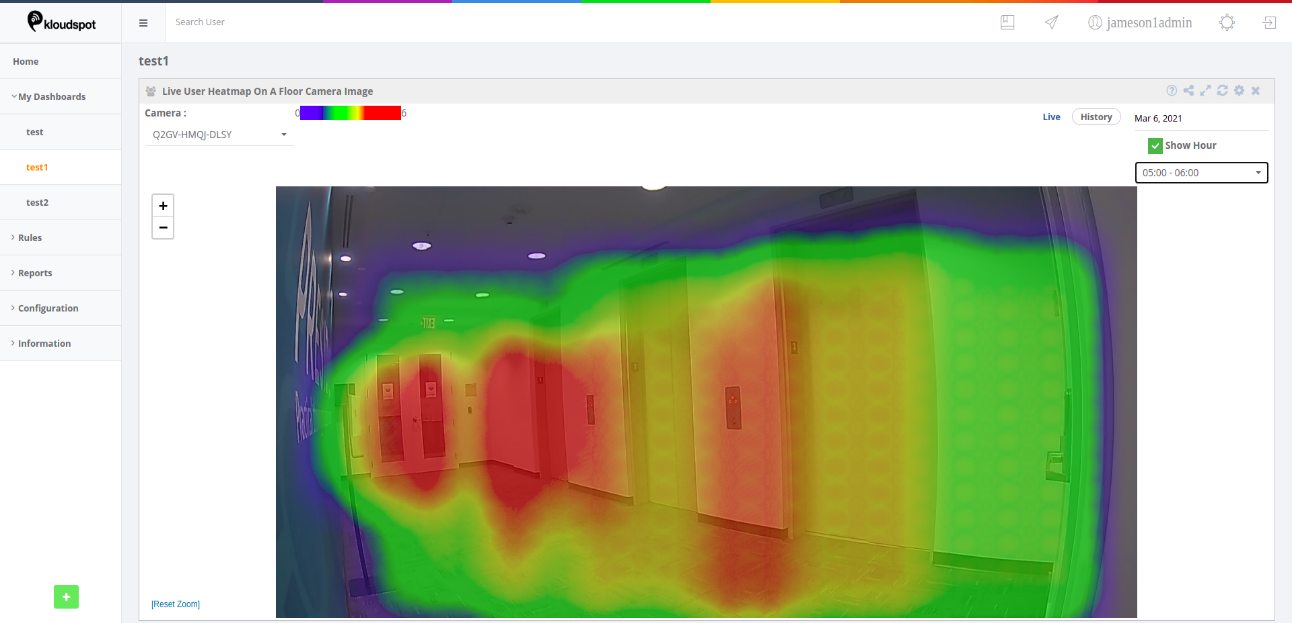
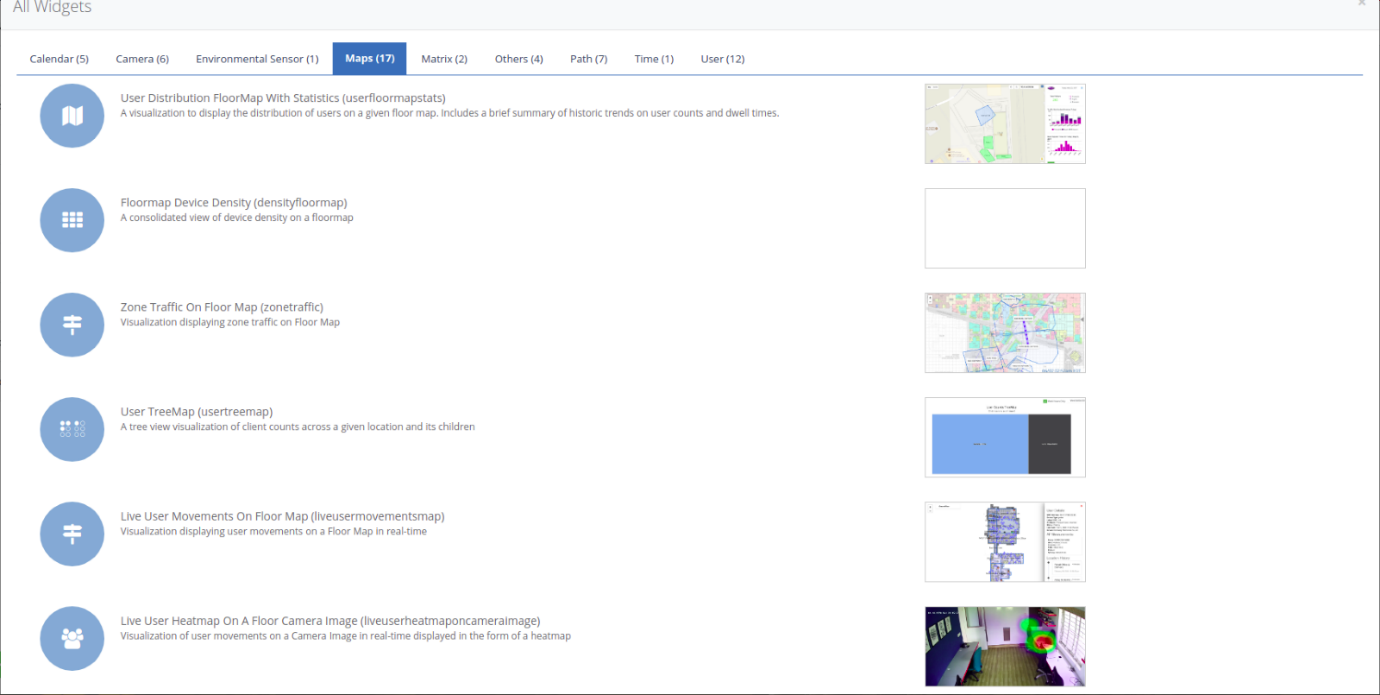
Live user heatmap on floor camera image’ Widget
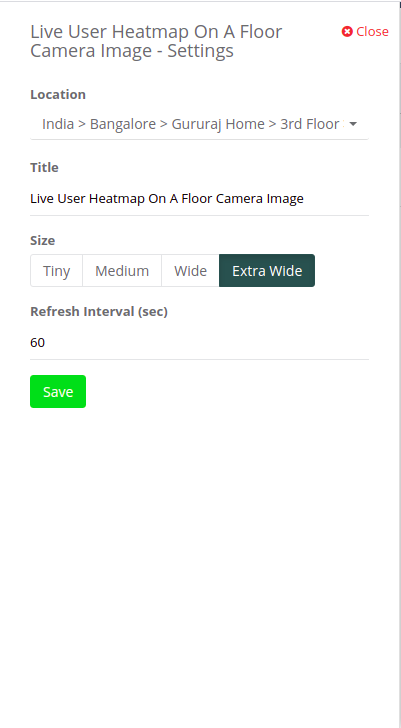
Step 1: To add the ‘Live User Heatmap On Floor Camera Image’ widget navigate to the ’Maps’ section and select ‘Live User Heatmap On Floor Camera Image’ widget.
Step 2: Select the location in which the camera is configured through the “Settings” option.
Step 3: Select the camera for which you want to see the heatmap.
Step 4: Clicking on the “Live Option” enables the user to view the live heatmap.
Step 5: Clicking on ‘history’, allows the user to view the heatmap for a specific day. The user can choose/pick any day from the date-picker.
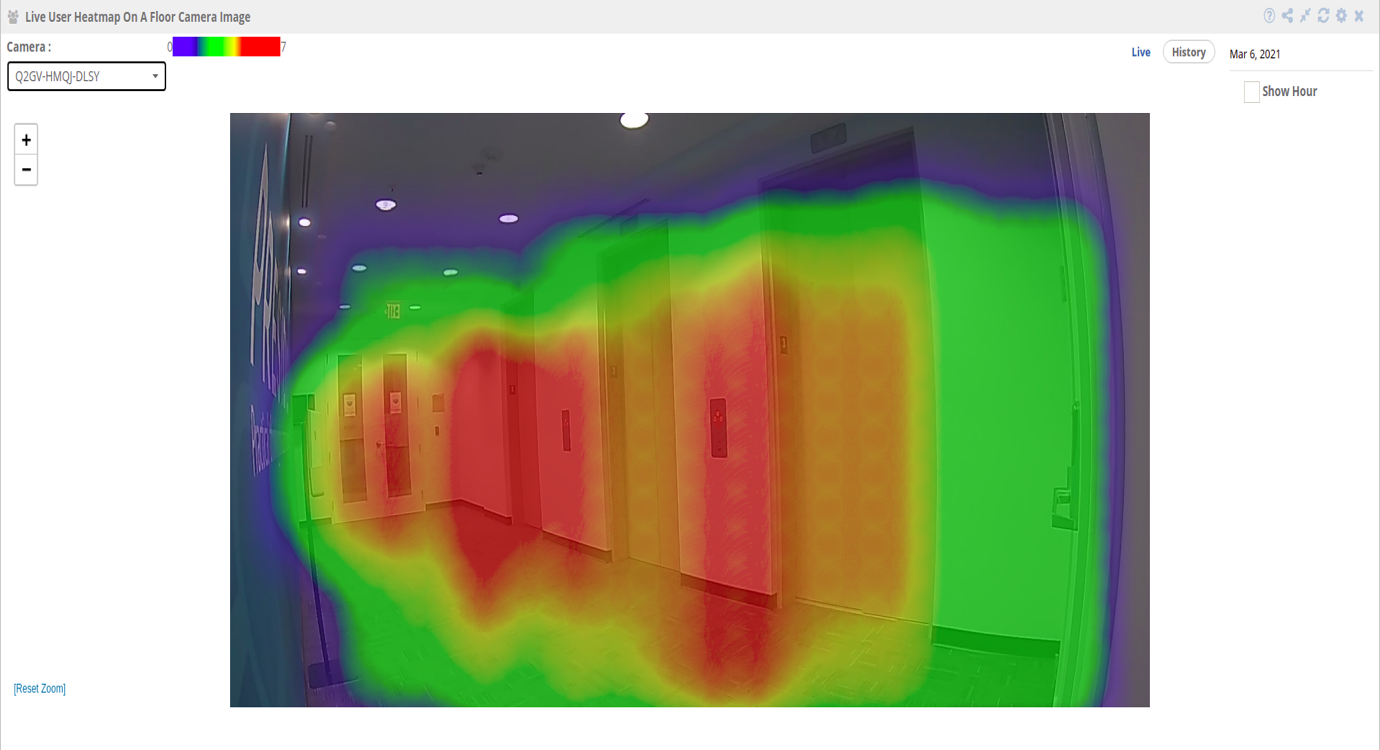
Step 6: Clicking on the “Show Hour” checkbox enables the user to view the heatmap data for any hour of the day.
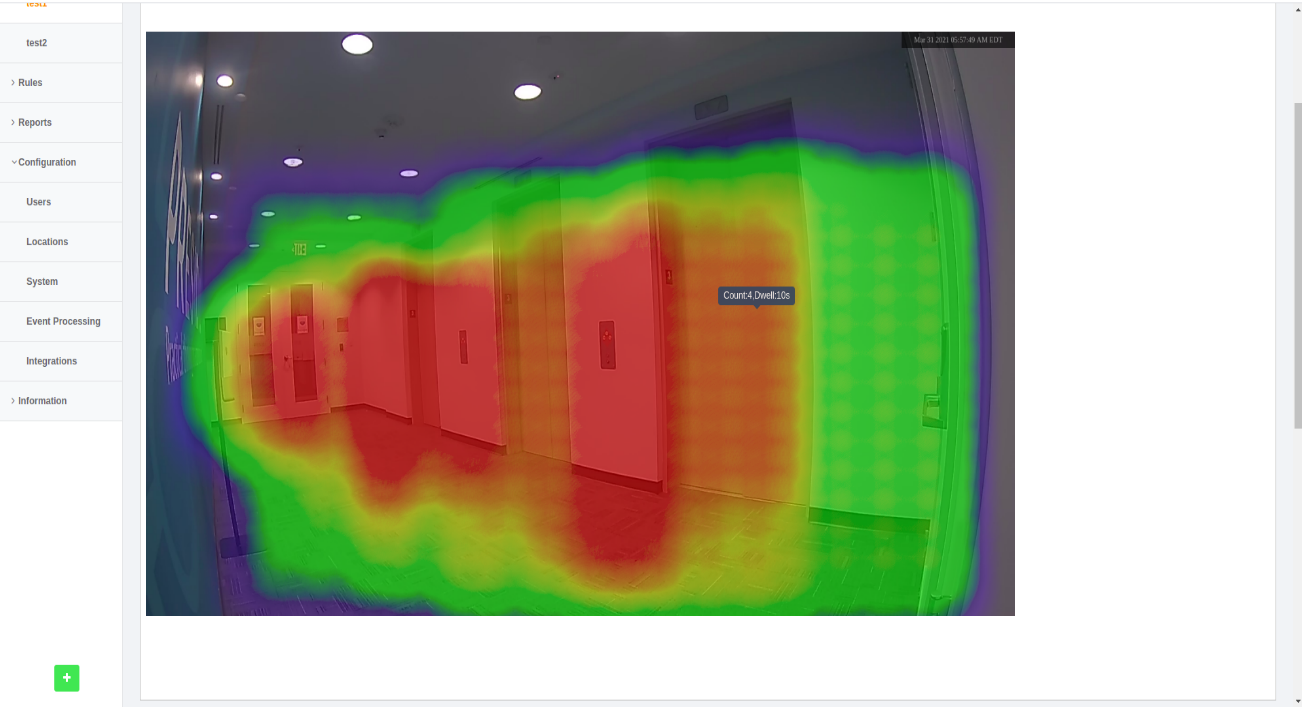
Step 7: A tooltip with the ‘count and dwell time’ can be seen when the user just hovers over the heatmap.
NOTE: User can Zoom in and out using the “+” and “-” symbol, respectively.